Proof of Concept: Remote Satellite Sensing Platform for Enhanced Agricultural Insights
How can farmers leverage cutting-edge technology to gain a deeper understanding of their fields, make more informed decisions, and ultimately increase their yields and sustainability? Crop Insight is a platform that enables farmers to closely examine their land with an unprecedented level of precision.
Why is such a tool necessary? In today’s agricultural sector, the difference between thriving and merely surviving often lies in the details—specifically, the health of every plant and the quality of the soil. Traditional methods of monitoring fields can be labor-intensive and may not always capture the full picture, leading to inefficiencies and missed opportunities. Crop Insight addresses these challenges head-on, offering detailed crop and soil health insights derived from sophisticated satellite data analysis.
Combining the innovative integration of Google Maps and Sentinel Hub APIs, this platform provides a comprehensive view of agricultural lands, enabling users to zoom in on specific areas for a closer look at vegetation health, moisture levels, and other crucial agricultural indices. The result? A powerful tool that empowers farmers with the knowledge they need to make decisions that boost productivity, enhance sustainability, and navigate the complexities of modern farming with confidence.
Who can use it?
Crop Insight is primarily designed for farmers, agricultural professionals, and agribusiness stakeholders. These users range from small-scale farmers seeking to optimize their land use and crop health to large agribusinesses aiming to monitor vast agricultural assets with precision. Additionally, agricultural consultants, researchers, and students in agronomy or environmental science fields might find the platform invaluable for data analysis, research, and educational purposes.
What to Use It For?
The platform can be used for a myriad of applications aimed at enhancing agricultural productivity and sustainability, including:
1. Land and Crop Analysis. Users can examine their land closely, identifying areas that require attention or could be optimized for better yields.
2. Health Monitoring and Prediction. Through detailed crop and soil health indices derived from satellite data analysis, users can monitor the health of their crops in real time and predict future crop health trends.
3. Irrigation and Fertilization Planning. By analyzing moisture levels and vegetation health, the platform helps in planning efficient irrigation and fertilization schedules.
4. Crop Rotation and Land Management. Agricultural indices such as the Barren Soil Index and Agriculture Index support decisions on crop rotation, land resting, and other practices to enhance soil health.
5. Temporal Analysis for Trend Monitoring. With the ability to select specific time frames for satellite imagery, users can monitor changes and trends over time, aiding in long-term planning and sustainability efforts.
What Are Its Benefits?
The integration of cutting-edge geospatial technology and agricultural tech through platforms like Crop Insight provides several benefits:
- Precision and Efficiency. By enabling farmers to select precise land parcels for analysis and providing detailed insights into crop and soil health, the platform significantly enhances the precision and efficiency of agricultural operations.
- Data-Driven Decision Making. The comprehensive suite of agricultural indices and the ability to analyze satellite imagery offer a data-driven foundation for making informed agricultural decisions.
- Enhanced Productivity and Sustainability. The insights provided by the platform help in optimizing agricultural practices, leading to increased yields, better resource management, and enhanced sustainability.
- Accessibility and User-Friendliness. Thanks to the intuitive user interface developed with the Vanilla.js framework, the platform is accessible and easy to use, even for those with limited technical skills.
- Flexibility and Comprehensive Analysis. The combination of Google Maps and Sentinel Hub API for interactive mapping and detailed satellite imagery analysis offers a flexible and comprehensive tool for modern farming needs.
“By combining detailed satellite imagery with a comprehensive suite of agricultural indices, we’re not just providing data; we’re offering a tool that enhances decision-making for farmers. With this level of precision and accessibility, we’re opening up new possibilities for sustainable agriculture and optimized crop management”.
DANIIL HORBAL, SOFTWARE DEVELOPER AT QALTIVATE
What is Crop Insight and how does it work?
The Proof of Concept (PoC) for this platform presents an innovative solution designed to empower farmers with advanced agricultural insights directly from their desktops or mobile devices. This platform integrates seamlessly with Google Maps, allowing users to select any agricultural field or area of interest with precision. Utilizing the Google Maps API, it enables the creation and interaction with a map interface, providing functionalities such as display customization, layer manipulation, and user interaction personalization.
Key to its utility is the integration of the Google Maps Drawing Library, which facilitates the selection of specific land plots by enabling users to draw polygonal areas that represent their chosen fields. This feature is instrumental in narrowing down the exact location for analysis, ensuring that the satellite imagery and agricultural indices fetched are highly relevant and accurate.
The platform uses the Sentinel Hub API to fetch detailed satellite imagery and a comprehensive suite of agricultural indices for the selected areas. These indices include:
- NDVI (Normalized Difference Vegetation Index)
- EVI (Enhanced Vegetation Index)
- Barren Soil Index
- Moisture Index
- Moisture Stress Index
- Agriculture Index
- SAVI (Soil-Adjusted Vegetation Index)
These indices provide vital information on vegetation health, soil condition, and moisture levels, among other agricultural parameters, enabling farmers to make informed decisions about their land and crops. The Sentinel Hub API also allows users to select specific time frames for the satellite imagery, offering temporal flexibility to monitor changes and trends over time.
To ensure that the platform remains user-friendly and intuitive, it utilizes the Vanilla.js framework, known for its capability to facilitate the rapid development of simple yet powerful user interfaces. This choice underscores the platform’s commitment to providing a seamless and accessible user experience, enabling farmers and agricultural professionals to leverage cutting-edge satellite technology with ease.
This PoC represents a significant step forward in agricultural technology, offering a tool that not only simplifies the process of land and crop analysis but also enhances the decision-making capabilities of its users through precise, data-driven insights.
The website described allows users to select land parcels using Google Maps, view satellite imagery, and access various agricultural indexes. This functionality is supported by integrating several key technologies:
- Google Maps JavaScript API. Utilized to create and interact with a map on the website. This API enables map display, working with different layers, and personalizing user interaction with the map.
- Google Maps Drawing Library. Employed to enable users to select land parcels on the map. It allows users to draw polygonal areas on the map, corresponding to their land parcel selection.
- Sentinel Hub API. Integrated for fetching satellite images and agricultural indexes such as NDVI (Normalized Difference Vegetation Index), EVI (Enhanced Vegetation Index), Barren Soil, Moisture Index, Moisture Stress, Agriculture, and SAVI (Soil-Adjusted Vegetation Index) for selected land parcels. This API also allows users to choose the time frame of the imagery.
- Vanilla.js Framework. Implementation for UI: Chosen for its simplicity and efficiency, the Vanilla.js framework was used to quickly develop an intuitive and user-friendly interface (UI).
The integration of the Google Maps Drawing Library with our platform allows farmers to handpick the exact parcels of land they want to analyze, transforming satellite data into actionable agricultural insights. This precision ensures that the analytics provided are not just data, but a roadmap for optimized farm management and increased yields.
DanIIL HORBAL, SOFTWARE DEVELOPER AT QALTIVATE
Structure Description & Features
User Interface (UI) Development
The UI is developed using the Vanilla.js framework, prioritizing speed and ease of use. This choice ensures a straightforward and efficient user experience.
Map Integration and Interaction:
The Google Maps JavaScript API is the backbone of map functionality on the website, enabling the display of maps, manipulation of layers, and customization of user interactions with the map.
Land Parcel Selection
The Google Maps Drawing Library enhances the site by allowing users to actively select and define specific land parcels using polygonal shapes directly on the map interface.
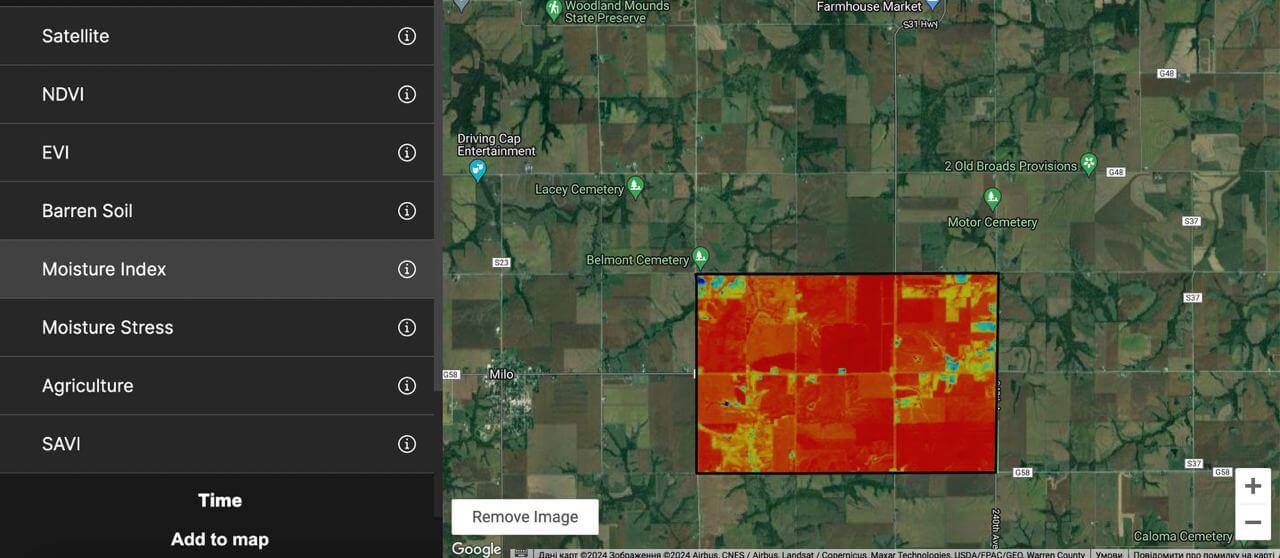
Satellite Imagery and Agricultural Index Access
Integration with the Sentinel Hub API provides users with access to valuable satellite imagery and various agricultural indexes for their selected land parcels. This includes the ability to specify the desired time frame for the imagery, offering a comprehensive view of the land’s condition and agricultural potential.
Understanding agricultural indexes is crucial for farmers to optimize crop health, yield, and overall farm management. Here’s a detailed look at the indexes mentioned and how farmers can benefit from them throughout the year and across different seasons:
NDVI (Normalized Difference Vegetation Index)
NDVI measures the difference between near-infrared (which vegetation strongly reflects) and red light (which vegetation absorbs) to assess vegetation density and condition.
It helps in monitoring crop health, estimating biomass, and predicting yield. Throughout the year, NDVI can guide irrigation, fertilization, and harvesting decisions by indicating plant stress before it’s visible to the eye.
EVI (Enhanced Vegetation Index)
EVI corrects for some atmospheric conditions and canopy background signals, providing more sensitive measurements of vegetation cover, chlorophyll content, and biomass than NDVI, especially in high biomass areas.
It’s particularly useful for ensuring optimal plant growth and health, especially in densely vegetated areas. EVI can aid in adjusting crop management practices to improve yield.
Barren Soil Index
This index identifies areas of bare soil, helping in the assessment of land use and management, including erosion risk and previously uncultivated lands.
Knowing the extent of barren soil can help in soil conservation efforts, identifying areas for potential cultivation, and monitoring the effectiveness of soil management practices.
Moisture Index
Moisture indexes assess the water content in soil and vegetation. They are crucial for determining drought stress and optimal watering levels.
Throughout the year, especially in varying seasons, these indexes help in managing irrigation more effectively, reducing water waste, and ensuring crops are not over or under-watered.
Moisture Stress Index
This index specifically measures the stress level of plants due to insufficient moisture, indicating potential drought conditions.
Early identification of moisture stress allows for timely irrigation adjustments, potentially saving crops from drought-induced damage and improving water resource management.
Agriculture Index
This broad index encompasses various factors relevant to agriculture, including vegetation health and soil quality, to provide an overall assessment of agricultural land productivity.
By assessing the productivity of their lands, farmers can make informed decisions about crop rotation, land resting, and other practices to enhance soil health and crop yields over time.
SAVI (Soil-Adjusted Vegetation Index)
SAVI adjusts NDVI for the influence of soil brightness, particularly useful in areas with sparse vegetation where the soil significantly affects the measurement of vegetation health. It offers more accurate information for making farming decisions in semi-arid regions or where the land cover is not densely vegetated, aiding in the detection of subtle changes in plant health.
How Farmers Benefit Year-Round and Across Seasons
- Spring. Early detection of vegetation health and soil moisture can guide planting decisions and initial watering schedules.
- Summer. Monitoring crop health and moisture levels helps manage irrigation precisely, optimizing water use during peak growth phases.
- Autumn. Insights into vegetation health and soil conditions can inform harvest timing and post-harvest management practices, like stubble retention to improve soil moisture.
- Winter. Assessment of barren soil and land productivity aids in planning for the next planting season, including decisions on crop rotation and land restoration efforts.
Armed with data from these indexes, farmers can tailor their agricultural practices to the specific needs of their crops and local conditions, enhancing sustainability, efficiency, and productivity throughout the agricultural cycle.